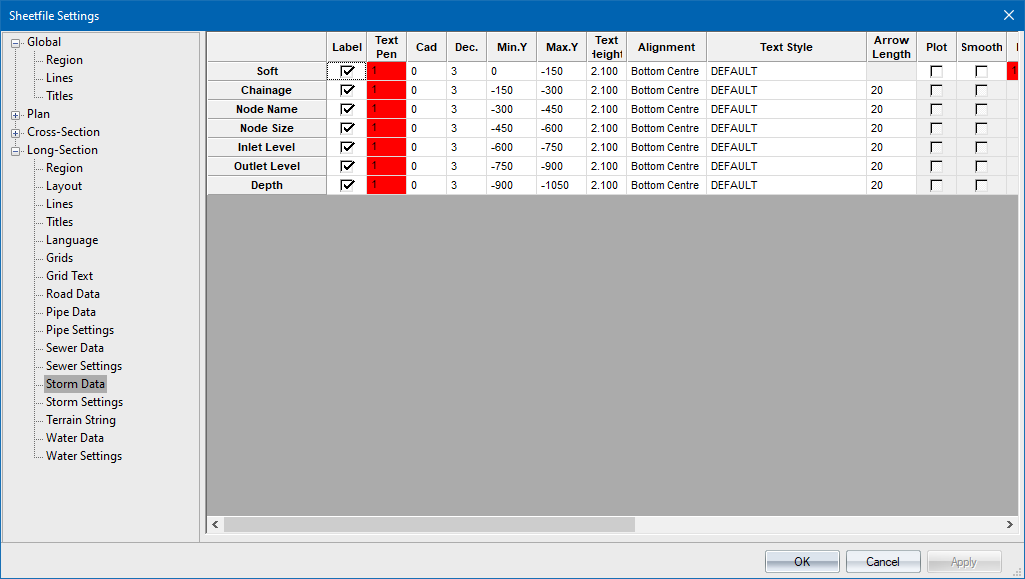
Long Section Storm Data
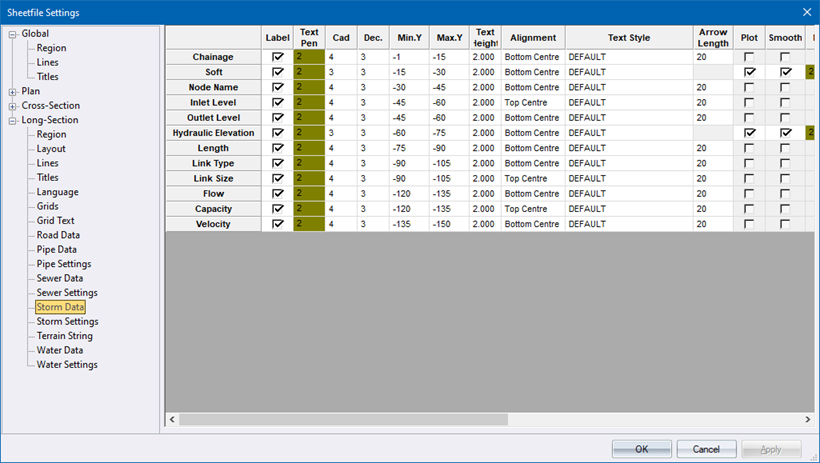
This page defines the plot settings for the section and detail areas for stormwater long sections.
 Some columns are not visible until you scroll right in the grid.
The grid contains combined settings for the section and detail area for storm water elements. The properties you can directly edit in the grid are:
|
Option
|
Description |
|
Label |
Select whether a data label should be generated for this attribute. When toggling the Pipe Crossing option to Yes (on), specify the text that has to be written next to the crossing services using the Crossing Services Text. |
|
Text Pen |
Select the pen in which to plot the label text. Right-click the cell to display the pen selection. |
|
CAD |
Enter the CAD layer on which the data label should be plotted. |
|
Dec |
Enter the number of decimal places to be used for the label value. |
|
Min. Y |
Enter the bottom coordinate of the area in which labels should be written relative to the datum line. |
|
Max. Y |
Enter the top coordinate of the area in which labels should be written relative to the datum line. |
|
Text Height |
Enter the height in mm. |
|
Alignment |
Select the alignment of the label text. |
|
Text Style |
Select the text style for the label text. |
|
Arrow Length |
Specify the length of the arrow. Detail area rows only. |
|
Plot |
Select whether this row is visible when printing/plotting. Section area rows only. |
|
Smooth |
Select whether the plotted line should be smoothed. Section area rows only. |
|
Pen |
Select the pen colour in which to plot the data line. Section area rows only. |
|
Line Style |
Select a line style for the data line. Section area rows only. |
|
All |
Select whether a line point and/or data value should be generated for every point in this long section line (checked) or only the bend manholes (unchecked). Section area rows only. |
|
Y Origin |
Enter the coordinate at which the label origins should be placed. This is an alternative method to using the Min Y and Max Y settings. Section area rows only. |
|
Exag |
Enter the chainage interval in metres at which data labels should be exaggerated. The text height at these labels will be 60% larger than the Text Height size above. Section area rows only. |
|
Text Rot |
Enter the angle (in degrees) at which label text should be written. Section area rows only. |
|
Underline |
Select this to draw a line under a data label from the defined Min Y to the defined Max Y coordinates. Section area rows only. |
|
Drop |
Select this to draw a line from the plotted data point down to the datum line. Section area rows only. |
Change Item
You can change the data parameter that a row refers to, while retaining the properties in that row. Right-click in the row header of the row whose parameter name you want to change, then select “Change Item” from the pop-up menu:
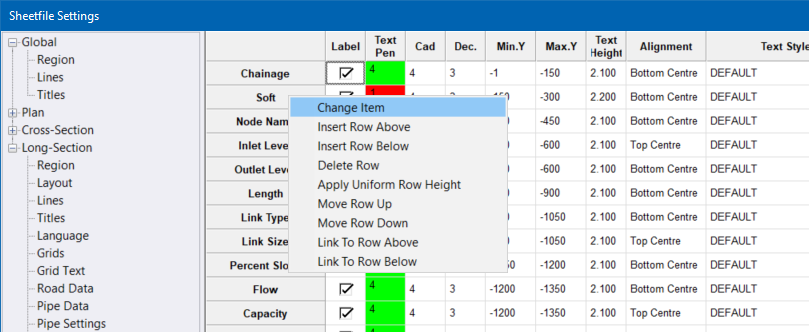
(In this example, we right-clicked on the row header for the 'Soft' row.) You will be prompted to select a parameter to replace the parameter you right-clicked on:
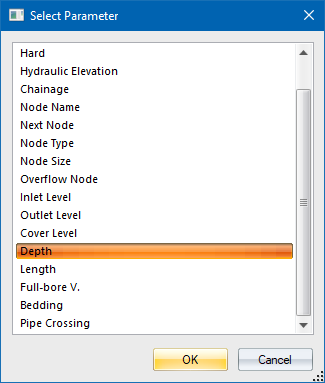
Once you select a new parameter, it replaces the row in the grid that you right-clicked on, however, the existing parameter properties/values in the row are retained (where possible):
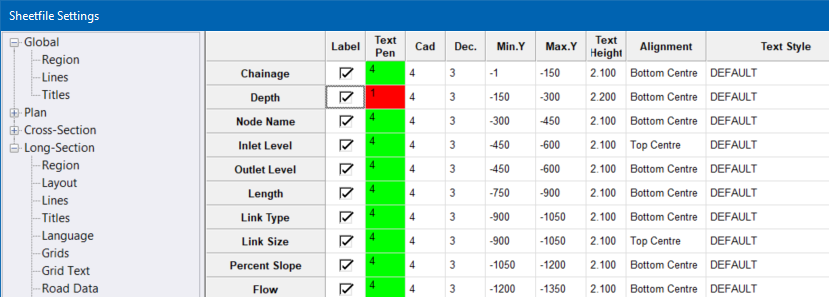
(In this example, the “Soft” row has been changed to the “Depth” row.)
Insert a Row
You can add long section labels by right-clicking in the row header of the row at which you want to insert the label, and then choosing Insert Row Above or Insert Row Below from the pop-up menu.
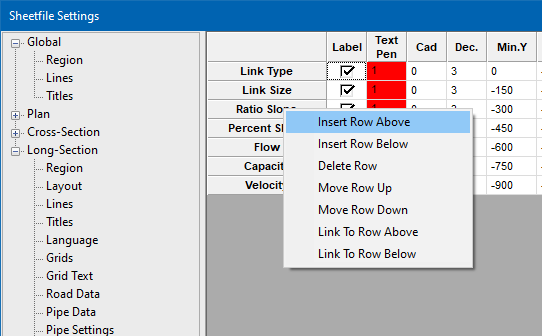
You are prompted to select the label to insert into the grid, from the list of labels which are not already displayed in the grid.
Once you select a parameter (label), it is inserted into the grid:
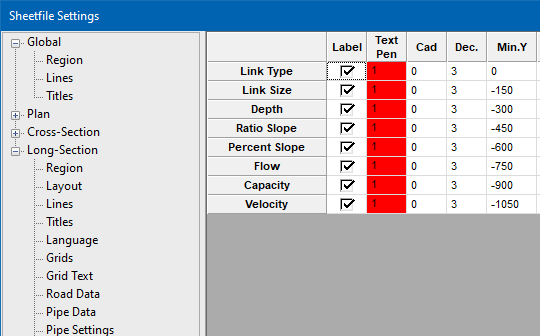
The newly inserted row's settings will be copied from the row you right-clicked on initially.
The MinY and MaxY values of the new row will be calculated from the adjacent rows, and the MinY and MaxY values for all the following rows will be adjusted.
Delete a Row
You can remove long section labels by right-clicking in the row header for the row you want to remove, and selecting Delete Row from the popup menu.
The indicated row will be removed from the grid. The MinY and MaxY values for all the following rows will be adjusted.
Move a Row Up or Down
You can re-order the labels by right-clicking in the row header for the row you want to move, and selecting Move Row Up or Move Row Down from the popup menu.
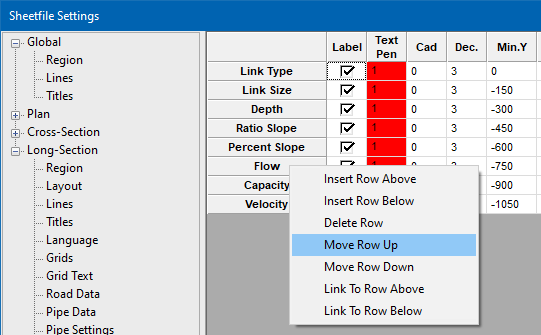
The indicated row will be moved up or down in the grid.
The MinY and MaxY values for the moved row, and the row it moved past, will be adjusted.
Link Data Rows
Two consecutive rows of data can "share" the same sheetfile output row if they have the same MinY and MaxY values. To easily link two rows, you can use the Link to Row Above or Link to Row Below right-click menu options. In the example below, we are linking the Inlet Level and Outlet Level rows.
Clicking Link to Row Above on the Outlet Level row. The two rows will now share MinY and MaxY values (-300 and -450):
Note how the MinY and MaxY of the rows below the linked rows has been adjusted so that they follow on directly from the linked rows.
You can also Unlink two linked data rows by using the Unlink Row option in the right-click menu.
Initialise Storm Long Section Data
If you are creating a new sheetfile, there will be no stormwater longsection data. In this case, you will not see the Storm Data grid, instead you will see a Create Storm Longsection Layout button.
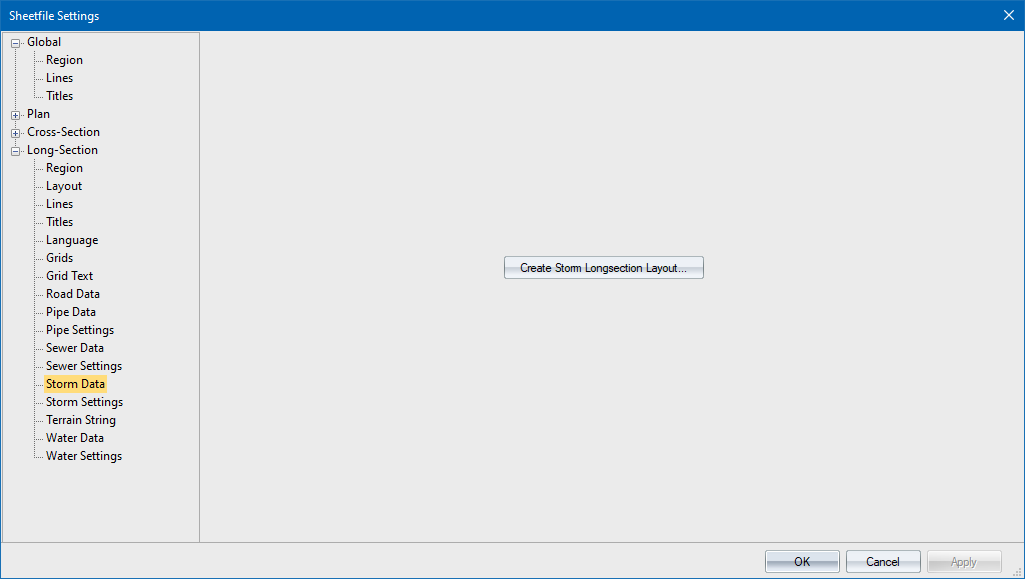
Click it to display the Create Layout dialog where you can choose which data row you want.
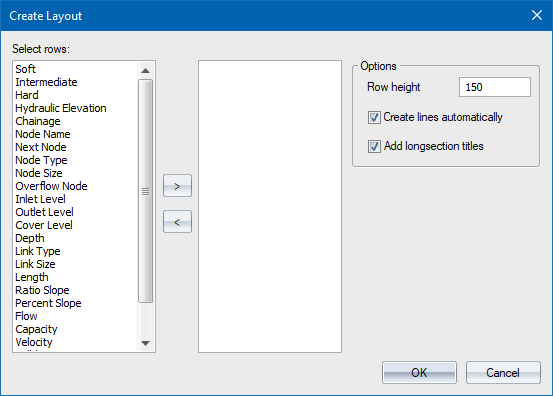
Select multiple rows in the left-hand list (available rows), and then click > to add them to the Selected Rows list to the right.
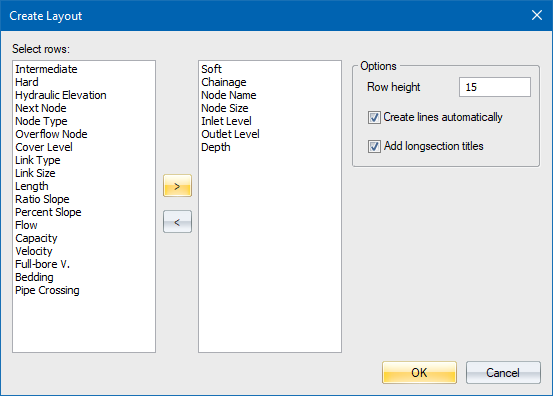
Click OK to set up the Storm Data grid with the rows you selected. Default parameter values for these rows will be applied.
Long Section ► Region Data and Long Section ► Layout data will also be populated with default values, if they were previously empty.
If you selected the Create lines automatically option in the Create Layout dialog, Long Section ► Lines data will also be populated.
If you selected the Add longsection titles option in the Create Layout dialog, Long Section ► Titles data will also be populated.