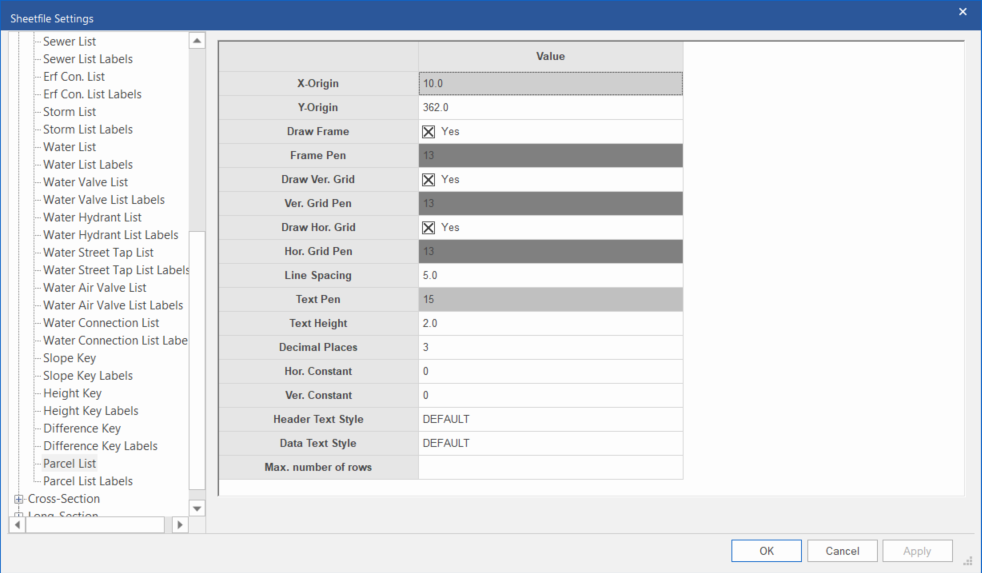
This page controls the drawing of a parcel schedule on the plan.
Note: A plan list will not actually appear in the SFE view until its corresponding plan list labels page has also been populated.
|
Option
|
Description |
|
X-Origin and Y-Origin |
Specify the position of the top-left corner of the list. |
|
Draw Frame |
Select whether the list should be framed. |
|
Frame Pen |
Select the pen in which to draw the list frame. Right-click the cell to display the pen selection. |
|
Draw Vert. Grid |
Select whether vertical lines should be drawn for each column. |
|
Vert Grid Pen |
Select the pen in which to draw the vertical lines. Right-click the cell to display the pen selection. |
|
Draw Hor. Grid |
Select whether horizontal lines should be drawn for each row- |
|
Hor Grid Pen |
Select the pen in which to draw the horizontal lines. Right-click the cell to display the pen selection. |
|
Line Spacing |
Enter the vertical spacing between successive rows in the list. |
|
Text Pen |
Select the pen in which to draw the list text. Right-click the cell to display the pen selection. |
|
Text Height |
Enter the text height in mm. |
|
Decimal Places |
Enter the number of decimal places to be displayed. |
|
Hor. Constant and Ver. Constant |
Enter the constants (in metres) to be subtracted from coordinate values before the text is drawn. |
|
Header Text Style |
Select the text style in which the header text should be drawn. |
|
Data Text Style |
Select the text style in which the data text should be drawn. |
|
Max. number of rows |
Enter the maximum number of rows to plot before wrapping to a new table. |
Autofill function
To save time and effort when filling in this grid, you can right-click on top-left cell of the grid and select “Add grid defaults” from the context menu. This will auto-populate the grid with default settings.