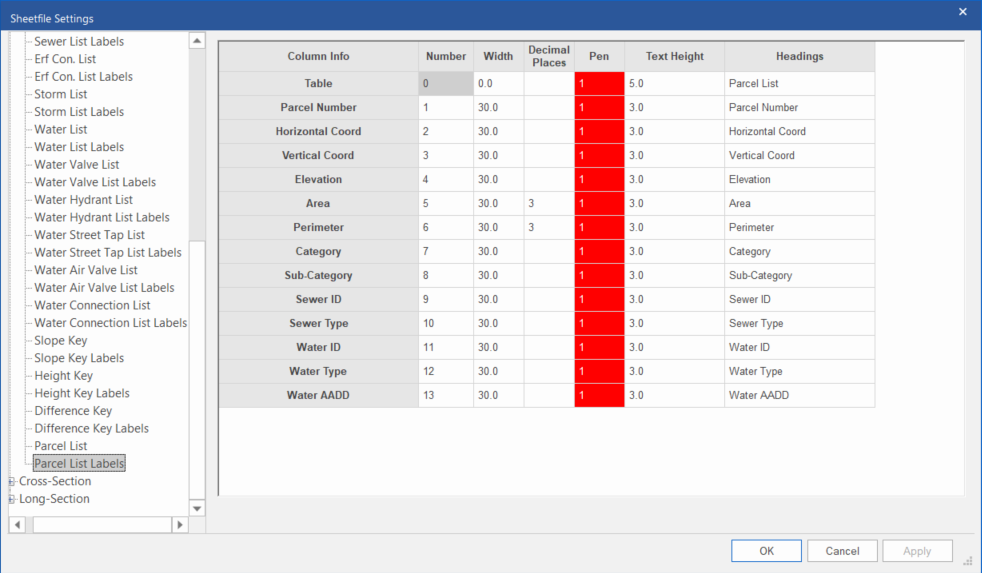
Define the label options of the Parcles schedule.
Note: The “Table” row specifies the settings for the plan list table “title”. The remaining rows each correspond to a column in the output plan list table.
|
Option
|
Description |
|
Number |
Enter the column number in which the relevant item should be drawn. To ignore a particular item set it's column number to 0. |
|
Width |
Enter the width of the column in mm. |
|
Decimal Places |
The number of decimal places for the plotted data in this column. Does not apply to some columns (for instance “Table”, and columns which show names/IDs). Note: If you specify decimal places here, it will override the “default” number of decimal places specified in the Plan -> Parcel List grid. |
|
Pen |
Select the pen in which the table or column heading should be drawn. Right-click the cell to display the pen selection. |
|
Text Height |
Enter the text height of the table or column heading in mm. |
|
Headings |
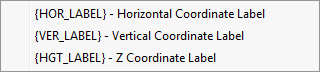
Enter the text for the table or column heading. Multiline text can be entered by entering the line feed character (\n) where necessary. Note that the same amount of line feeds must be inserted for all the columns.
Right-click to display a list of data items.
|
Autofill function
To save time and effort when filling in this grid, you can right-click on top-left cell of the grid and select "Column Info" from the context menu. This will auto-populate the grid with default settings.