|
Option
|
Description |
|
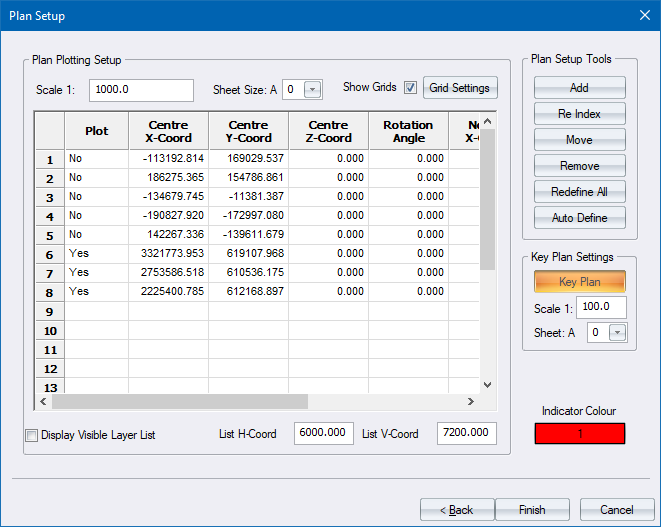
Scale |
Enter the desired scale for the generated drawing. |
|
Sheet Size |
Select a sheet size from the list. |
|
Show grids |
Select this checkbox to have grids (if defined) displayed on the drawing. |
|
Grid Settings |
Click to display the Grid Settings in order to customise the grid settings. |
|
Plan List |
|
|
Plot column |
Select whether the relevant plot should be generated (Yes) or not (No). Right-click this cell to toggle. Right-click the column heading to toggle the status of the first row AND set all other rows to match. |
|
Centre X Coord column |
Enter the X (horizontal) coordinate of the centre of the relevant plot definition. |
|
Centre Y Coord column |
Enter the Y (vertical) coordinate of the centre of the relevant plot definition. |
|
Centre Z Coord column |
Enter the Z (height) coordinate of the centre of the relevant plot definition. |
|
Rotation Angle column |
Enter the angle, in degrees, at which to rotate the relevant plot definition. |
|
Normal X Coord column |
Enter the X (horizontal) coordinate of the direction vector for the relevant plot definition. 3D Only. |
|
Normal Y Coord column |
Enter the Y (horizontal) coordinate of the direction vector for the relevant plot definition. 3D Only. |
|
Normal Z Coord column |
Enter the Z (height) coordinate of the direction vector for the relevant plot definition. 3D Only. |
|
Display Visible Layer List |
Select this checkbox to add a list of all visible layers to the generated plot. This option is only active if a Layer List has been defined in the sheet file. |
|
List H-Coord |
Enter the horizontal coordinate at which to place the top left corner of the list. This value is in 10ths of a millimetre, measured from the bottom left corner of the plot sheet. |
|
List V-Coord |
Enter the vertical coordinate at which to place the top left corner of the list. This value is in 10ths of a millimetre, measured from the bottom left corner of the plot sheet. |
|
Plan Setup Tools |
|
|
Add |
Click to define a new plot definition or to generate an immediate plot. |
|
Re Index |
Click to redefine the plotting order of existing plot definitions. |
|
Move |
Click to update the position of an existing plot definition. |
|
Remove |
Click to delete an existing plot definition. |
|
Redefine All |
Click to remove all existing plot definitions and start the definition of a new plot. |
|
Auto Define |
Click to automatically generate plot sheets along the alignment of the active road, or within a user defined rectangle. |
|
Key Plan Settings |
|
|
Key Plan |
Click to display the Key Plan Generator. This is a toggle switch - if the button is depressed a key plan will be created before the predefined plots. |
|
Scale |
Enter the scale for the key plan. |
|
Sheet |
Select a sheet size for the key plan. |