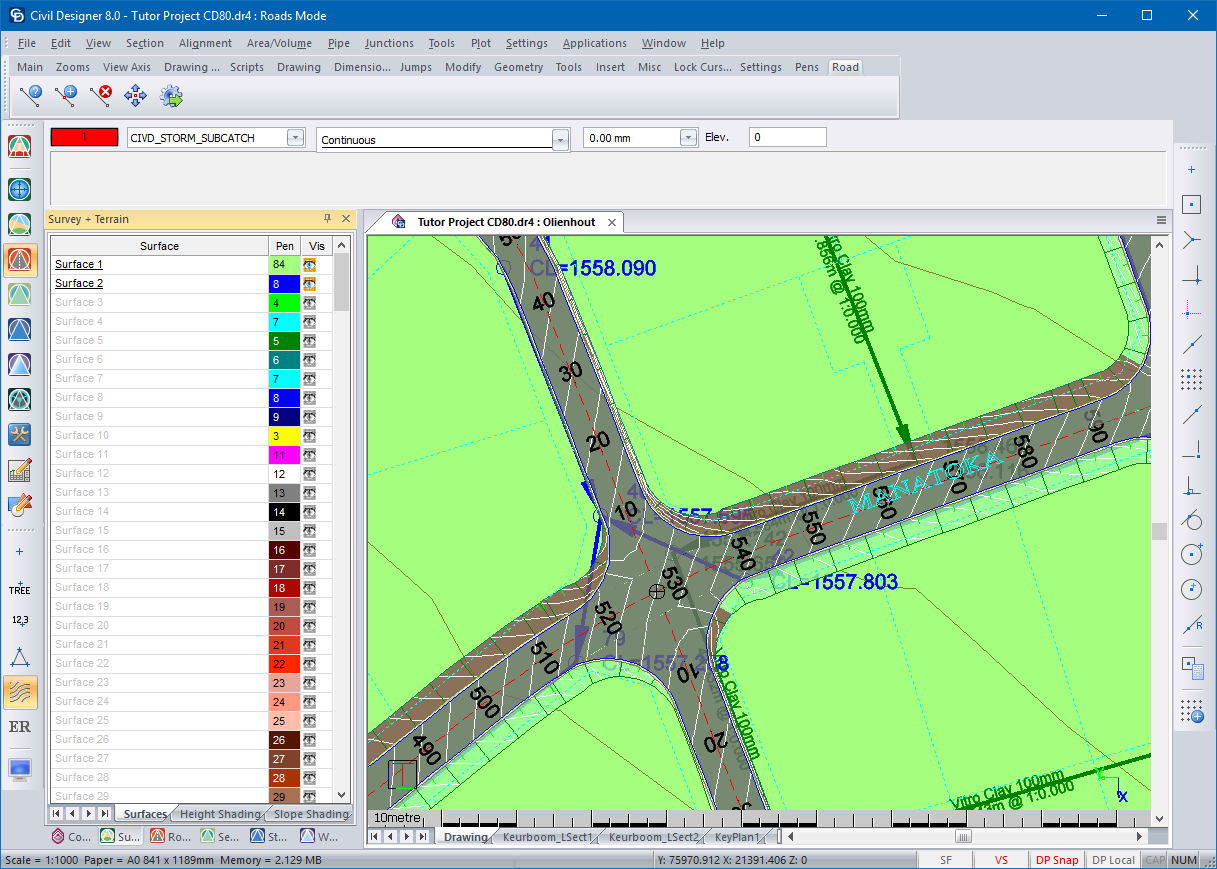
Control Centre
Display the Control Centre.
|
Icon |
Command |
Shortcut Key |
Toolbar |
|
|
CONTROLCENTRE |
|
Misc |
This function allows you to display the Control Centre, which displays information about the following objects in the drawing:
-
Layers
-
Line styles
-
Text Styles
-
Dimension Styles
-
Multiline Styles
-
Hatch Patterns
-
Blocks
-
Named Views
-
Named DPs
This function allows you to display the Control Centre, which gives easy access to various information on a per-module basis:
-
CAD Mode
- Layers
- Drawing
- Block Browser
-
Survey + Terrain Mode
- Surfaces
- Strings
- Height Shading
- Slope Shading
-
Roads Mode
- Roads
- Extract Strings
- Clashes
You can toggle the visibility of drawing layers by right-clicking the Visibility icon.
Procedure
The Control Centre displays in it's last position.
It can be freestanding or attached to the left, right, top or bottom of the drawing area by clicking on it's Title Bar and dragging it to the required position.
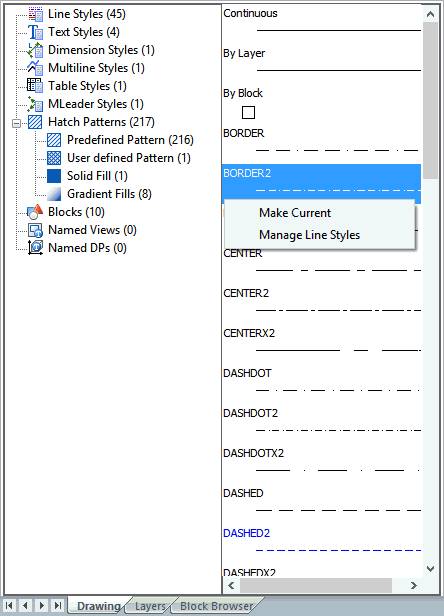
Drawing Tab
The Drawing tab displays the information of all the style objects in the drawing:
-
Line Styles
-
Text Styles
-
Dimension Styles
-
Multiline Styles
-
Table Styles
-
Multileader Styles
-
Hatch Patterns
-
Blocks
-
Named Viewports
-
Named DPs
- If you click on an object type in the left pane of the Control Centre, samples or previews of all objects of that type will be listed in the right pane.
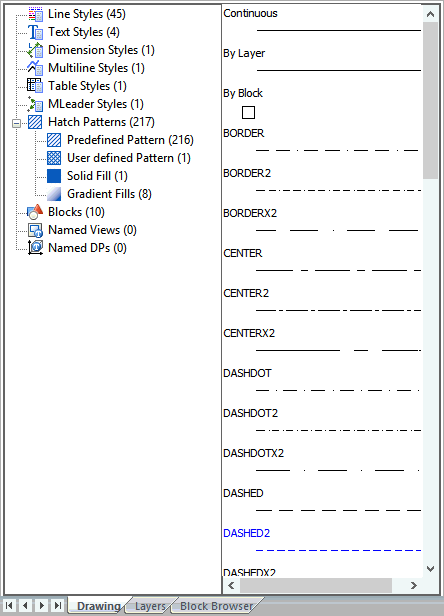
- You can select an item on the right of the list, right-click and display a popup menu with options for that item.
Layers Tab
- Click the Layers tab to display information about the layers in the drawing.
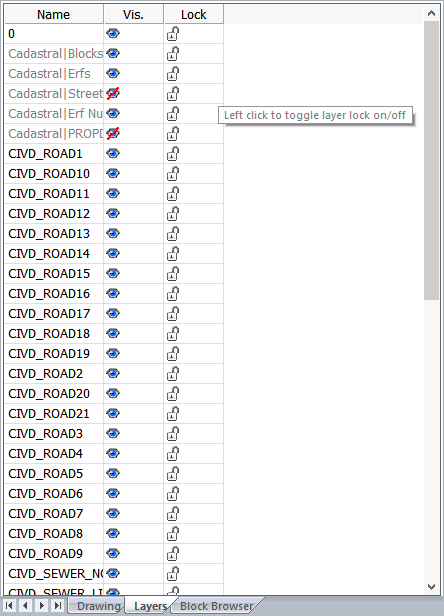
-
Layer visibility and lock status can be changed by clicking on the relevant icon in the list.
- The current layer is drawn in red. You can also set the current layer by right-clicking on the relevant layer in the list.
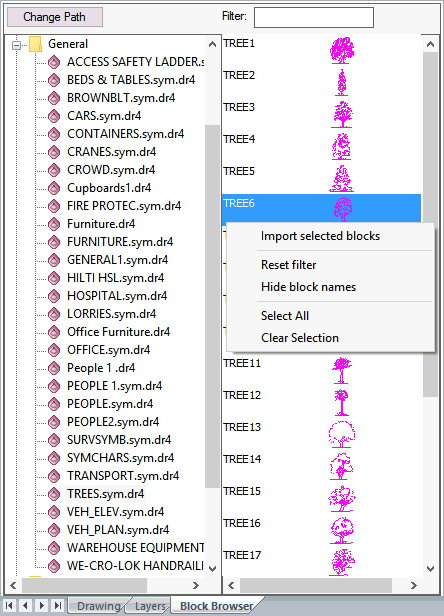
Block Browser Tab
- Click the Block Browser tab to display a folder tree of available block files (symbol files).
-
Click a block file in the left pane to list all the blocks in that file.
-
Right-click a block in the right-hand pane to display a popup menu with these options:
-
Import Selected Blocks - Add the selected blocks to the current drawing.
-
Reset Filter - Clear the current block name filter.
-
Hide Block Names - Hide the names of the blocks in the list.
-
Select All - Select all the blocks in the list.
-
Clear Selection - Make sure no blocks are selected.
-
- You can also double-click a block to import and insert it.
Change Path
If you want to browse blocks from a different folder, click Change Path to select a new root folder for the Block Browser. The folders and DR4 files under the new root folder will be displayed in the Block Browser folder tree in the left pane.
If you select a new root folder, the Change Path button will change to Reset Path. Click Reset Path to reset the root folder back to its default location - "AllyCAD 2D Symbols" folder.
Block Name Filter
If a large number of blocks are listed in the right pane, you can use the Filter option to display only blocks whose names begin with the characters you enter in the Filter input box.
 The block name filter stays active even if you select a different symbol file. Remove the filter by deleting all the characters in the Filter input box, or right-click and select Reset filter.
Survey + Terrain Mode
In the Control Centre, select the Survey + Terrain icon to open the Survey + Terrain Control Centre, which contains four tabs:
-
Surfaces
-
Strings
-
Height Shading
-
Slope Shading
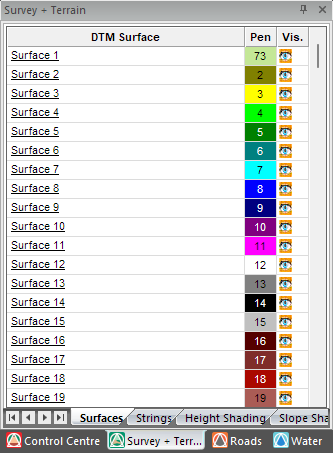
Surface Tab
|
Option
|
Description |
|
DTM Surface column |
Enter the name to be used for this surface. |
|
Pen column |
Select the pen in which points, including names and heights, on this surface should be displayed. Right-click the relevant cell to access the standard pen selection options. |
|
Vis. column |
Toggles the visibility of this surface. Right-click the relevant cell to toggle between Yes and No. DTM points that are not visible cannot be selected in those functions which act on individual points. |
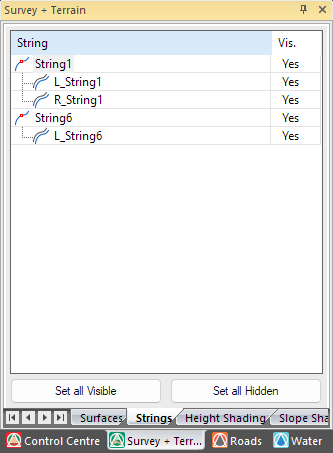
Strings Tab
|
Option
|
Description |
|
String column |
The string name. |
|
Vis. column |
Toggles the visibility of this string |
|
Set all Visible |
Press to set the visibility of all strings to On |
|
Set all Hidden |
Press to set the visibility of all strings to Off |
|
Right-click menu |
|
|
Select |
Set the chosen string to be the currently selected string |
|
Delete |
Delete the chosen string |
|
Properties |
Jump to the Properties Bar for the chosen string |
|
Show |
Zoom and Pan to the chosen string |
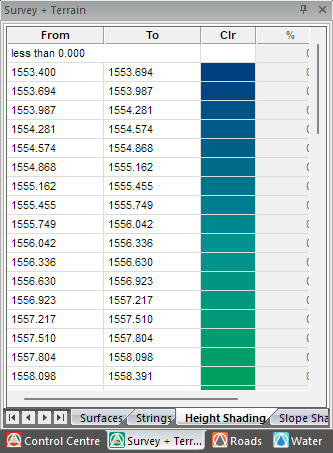
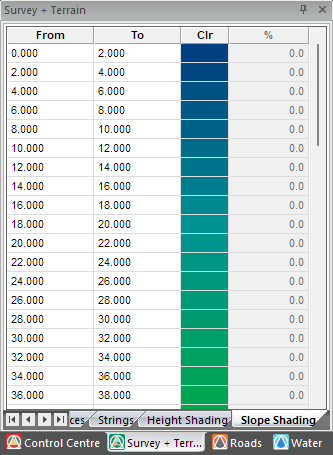
Height Shading Tab
|
Option
|
Description |
|
From column |
Enter the minimum height for this range interval |
|
To column |
Enter the maximum height for this range interval |
|
Clr column |
Specify a colour with which to shade the range. |
|
% column |
Enabled only if Hardware Acceleration is Off. Displays the percentage of screen real estate taken up by this range interval. |
Slope Shading Tab
|
Option
|
Description |
|
From column |
Enter the minimum height for this range interval |
|
To column |
Enter the maximum height for this range interval |
|
Clr column |
Specify a colour with which to shade the range. |
|
% column |
Enabled only if Hardware Acceleration is Off. Displays the percentage of screen real estate taken up by this range interval. |
Roads Mode
In the Control Centre, select the Roads icon to open the Roads Control Centre, which contains three tabs:
Roads Tab
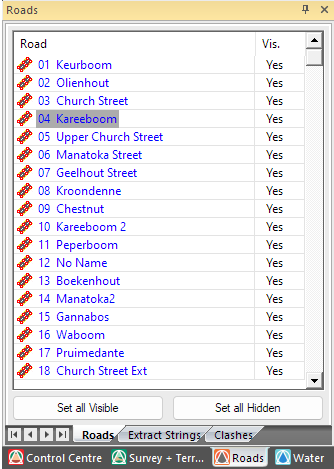
|
Option
|
Description |
|
No column |
Read-only column that indicates the road number. |
|
Name column |
The road names display in this column and you can edit them as required. Road names will be displayed in blue if it is a Strings road or black if it is a Cross section road. Refer to Select Road File. The current road is highlighted in blue. |
|
Vis column |
This column indicates if the road is visible or hidden. You can toggle the road visibility. |
|
Set all Visible |
Press to set the visibility of all roads to On |
|
Set all Hidden |
Press to set the visibility of all roads to Off. |
| Right-click menu | |
|
Set Current Road |
Select this option to set the selected road as the current road. |
|
Edit Layers |
Select this option to edit the layer names for the selected road. |
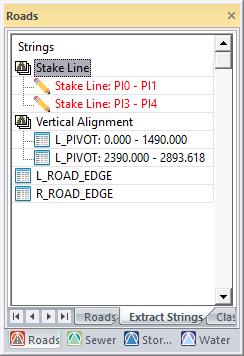
Extract Strings Tab
You can control the strings that have been extracted from the CAD/DTM from the Control Centre. You can access the same functionality by selecting Alignment ► Regression ► Extract String but this page is just for convenience. From this page you can:
-
Indicate (target) CAD entities from which data will be extracted.
-
Release (un-target) a string so it will be calculated from the edge control spreadsheets.
-
Edit the extraction settings.
- Recalculate the road.
|
Option
|
Description |
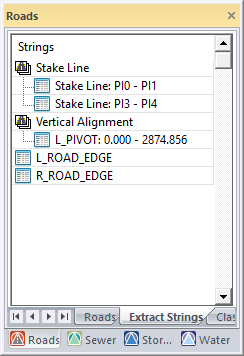
| Strings | |
|
Stake Line |
All stake line extraction sections will be listed under this heading and can be collapsed or expanded. |
|
Stake Line # |
Each stake line extraction section (as defined in the Horizontal alignment) will be listed. The PI names, between which the extraction will be done, will be indicated. |
|
Vertical Alignment |
All vertical alignment extraction sections will be listed under this heading and can be collapsed or expanded. |
|
L_PIVOT: ## |
Each vertical alignment extraction section, as defined in the Vertical Alignment, will be listed. The chainage ranges, between which the extraction will be done, will be indicated. |
| Pencil Icon | Indicates that target entities have been specified, from which data will be extracted. |
| Speadsheet Icon | No entities have been specified, so normal alignment and edge control data will be used. |
| Right-click menu | |
|
Indicate |
Select this option to graphically indicate a CAD entity that this string will be targeted to. |
|
Extraction Settings |
This option is available if the string is already targeted to CAD entities. Select it to change the extraction settings via the Extract Strings dialog. |
|
Recalculate Road |
Select this option to recalculate the selected road. If the extraction settings/target state of one of the Pivot strings have been changed, the vertical levels will be recalculated. Otherwise, the edge levels will be calculated and templates applied. |
Stake Line Extraction Sections
-
To indicate CAD/Road Strings target entities for an extraction section, click on the appropriate spreadsheet icon.
-
In the Target entities dialog, specify if you want to extract from CAD entities or Road entities.
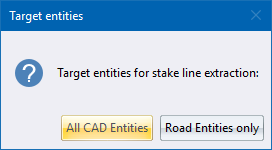
-
Click Road Entities only and follow the same process of selecting road strings as per the Extract Strings function.
-
The red stake line extraction sections indicate that you need to recalculate. Right-click and select Road Recalculate.
-
When you select a Stake Line extraction section, the target entity will be highlighted.
Vertical Alignment Extraction Sections
-
Right-click the Vertical Alignment node and select the Add Extraction range option to display the following bar:
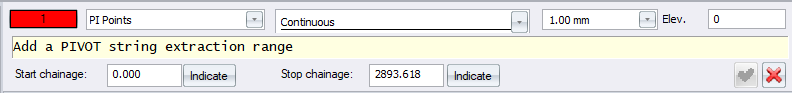
-
Enter the start and stop chainage of the vertical extraction range you would like to add and click OK. Alternatively, click on the respective Indicate buttons to graphically indicate the chainage.
-
Civil Designer will add VPIs into the Vertical Alignment definition for the extraction range. Bear in mind that extraction ranges are not allowed to overlap with existing vertical curves.
-
Once the extraction ranges have been added, you can click the Spreadsheet icon to indicate the target entities.
- Once the extraction ranges have been inserted, you can delete them by selecting an extraction, right-clicking and selecting the Delete Extraction Range option. Civil designer will automatically delete the appropriate extraction VPIs from the vertical alignment definition.
Clashes Tab
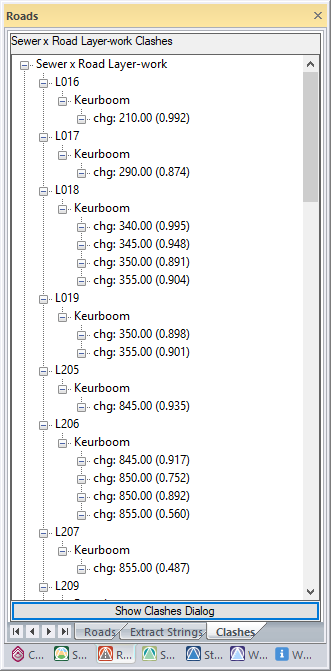
|
Option
|
Description |
| Show Clashes Dialog button | Click to open the Service Clashes dialog. |
| Clashes Tree - Left-click | Click any of the clashes in the tree control to see the location of the clash. |
| Clashes Tree - Right-click | |
|
Long-Section |
In Pipe Services, the Long Section Editor displays. For roads, the Vertical Alignment Editor displays showing crossing services. |
|
Cross-Section |
If you calculated clashes with the road layerworks, the Cross-Section Editor displays showing the selected chainage with crossing services. |
Issues Bar
Control Centre CDE Issues Bar
View Issues
Displays all project issues from the CDE Setup.
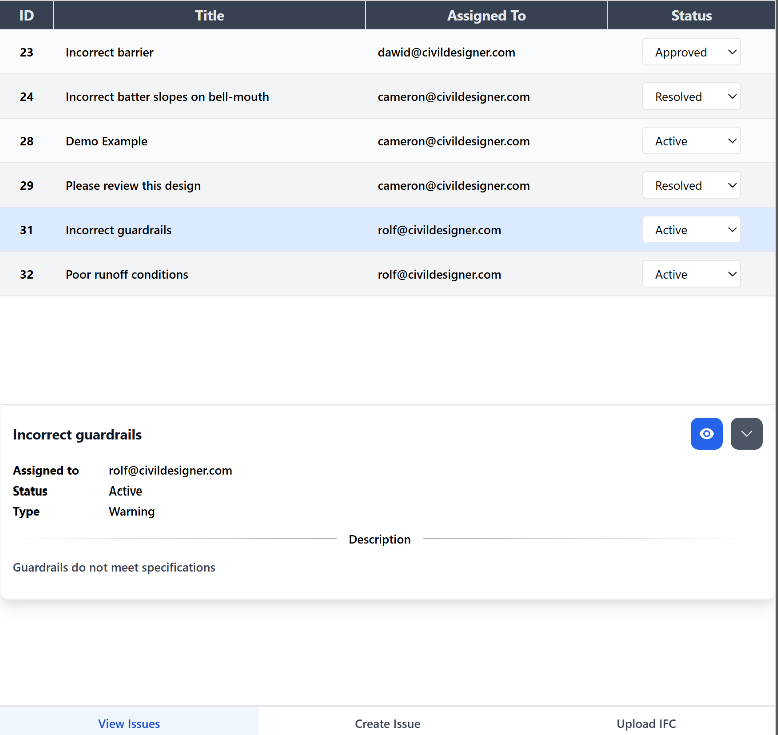
Procedure
- Right-click to refresh to reload issues.
- Select an issue to view its status, type, and description.
- Change status (updates automatically in the connected CDE).
- Click the blue eye icon to pan to the issue in Civil Designer.
- Click the grey icon to unselect the selected issue
Create Issues
Create a new issue in the selected project.
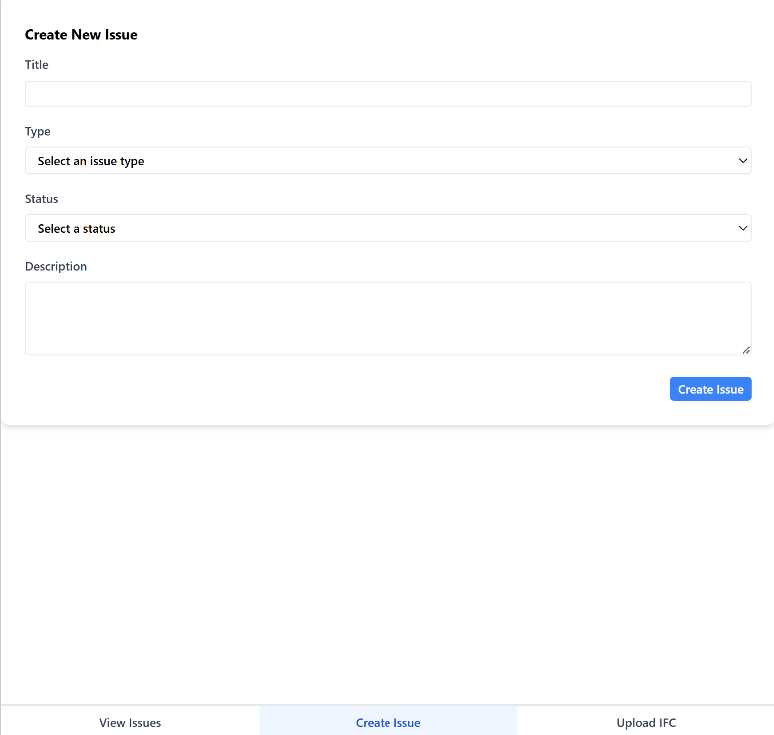
|
Option
|
Description |
|
Title |
Enter a brief issue name |
|
Type |
Select issue type from dropdown |
|
Status |
Select initial status from dropdown. |
|
Description |
Provide detailed description |
|
Create Issue |
Click to submit to the connected CDE project |
Upload
Upload an IFC model to the selected CDE.
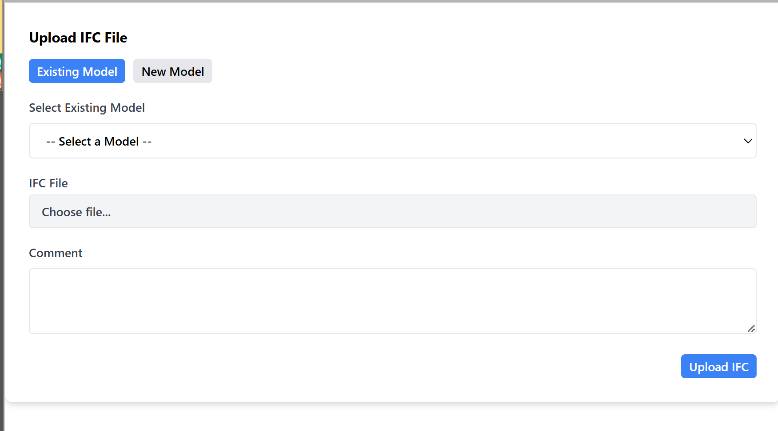
|
Option
|
Description |
|
Existing Model |
Click to upload an IFC to an existing model. |
|
New Model |
Click to upload an IFC to a new model. |
|
Select Existing Model |
Select an exiting model from the dropdown or add a new model name. |
|
IFC File |
Select an IFC file to upload. |
|
Comment |
Add a comment for this upload |
|
Upload IFC |
Click to submit to the selected CDE. |