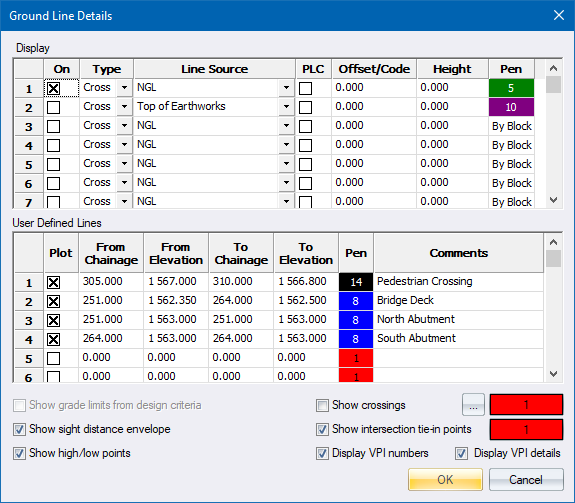
Specify what data must be displayed on the vertical alignment and edge level windows.
|
Option
|
Description |
|
Display |
These settings control the display of up to 100 lines extracted from the road layer data. |
|
On |
Select this option to turn on the display of the selected line. |
|
Type |
This can be Cross (extracted from the cross sections), DTM (extracted from a terrain surface) or DTM+Strings (extracted from a terrain surface and include the strings model). |
|
Line Source |
Select the layer/surface from which the additional long section data should be extracted. |
|
PLC |
Select this option and enter the point location code (PLC) of the points that form the longsection. |
|
Offset/Code |
Enter the offset of the points that form the longsection. Only available if the PLC option is not checked. Offsets left of the centreline must be entered as a negative value. You can also use point descriptors.
|
|
Height |
Enter a height constant for the selected ground line e.g. enter -1.5 to display a line 1.5 m below the selected ground line. |
|
Pen |
Click to select the pen in which the selected line should be drawn. |
|
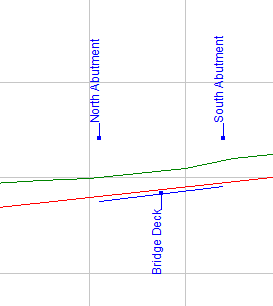
User Defined Lines |
These settings control the display of up to 50 user-defined lines or comments specified by road chainage and elevation.
|
|
Plot |
Enter Yes or No to specify whether this line should be plotted. Right-click on the cell to toggle the current entry. |
|
From Chainage |
Enter the start chainage of this line. |
|
From Elevation |
Enter the start elevation of this line. |
|
To Chainage |
Enter the end chainage of this line. |
|
To Elevation |
Enter the end elevation of this line. |
|
Pen |
Enter the pen number of the colour in which this line should be displayed. Right-click the cell to display the colour selection dialog. |
|
Additional display options |
|
|
Show grade limits from design criteria |
Select this option to display the grade envelopes from the Design Criteria. This option is only available if you are using Design Criteria.
|
|
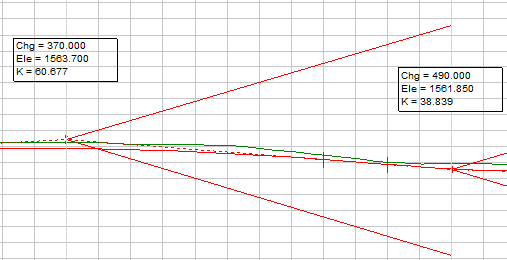
Show sight distance envelope |
Select this option to show the results of the Sight Distance Check on the alignment. |
|
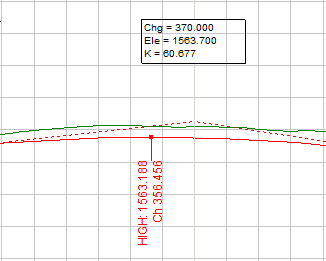
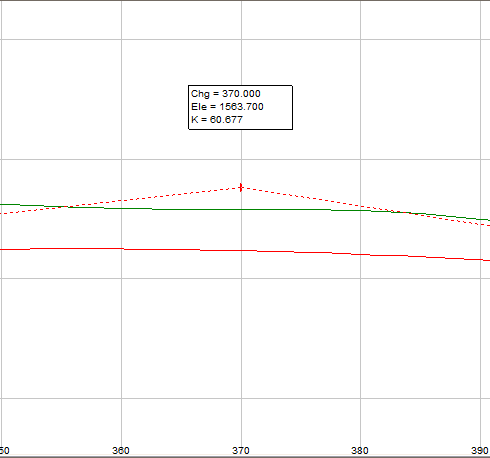
Show high/low points |
Select this option to show high and low points on the alignment.
|
|
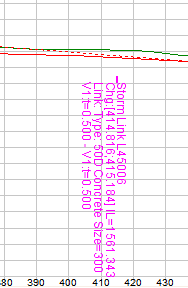
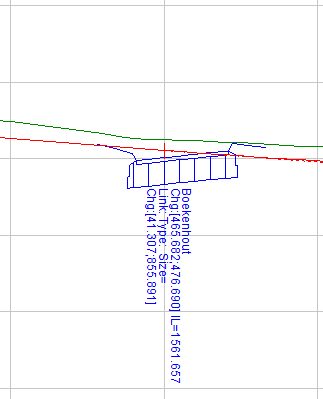
Show crossings |
Select this option to display crossing services on the Vertical Alignment View. The Crossing Services Settings will be displayed when you switch this option on.
|
|
Crossing crossings pen |
Select the pen to display crossing pipes. |
|
Show intersection tie-in points |
Select this option to display the intersection tie-in points where this road intersects with other roads.
|
|
Intersection tie-in points pen |
Select the pen to display tie-in points |
|
Display VPI numbers |
Select this option to display the VPI numbers on the vertical alignment graph.
|
|
Display VPI details |
Select this option to display the vertical curve details on the vertical alignment graph.
|
See Also Vertical